 EN
Global air cargo volume grew by 9% in 9, with demand rising on China–US routes

 AMZ123 learned that the latest data released recently by WorldACDshowed that global air cargo volume in 2026 9 increased 3% from the previous month and 9% year on year, ending the brief slowdown in 8.
However, from mainland China andHong Kong, Chinato Europe, air cargo volume has still not recovered to the level of the same period last year. It fell 10% year on year in 9, although the decline narrowed compared with 7 and 8. Meanwhile,Chinaair cargo volume to the United States continued to grow, rising 17% year on year in 9, with the two major trade lanes showing a clear divergence in performance.
WorldACD data show that growth in global air cargo volume in 9 covered the major origin regions. Air cargo volume originating in both the Asia-Pacific region and North America grew 10% year on year; the Middle East and South Asia (MESA) grew 9%; Europe and Africa each grew 8%; and Centraland South Americagrew 5%.
As for rates, transportation costs in the global air cargo market remained high. After falling in 6 and 7 and stabilizing in 8, the global average all-in air cargo rate rose 1% month on month in 9 and 25% year on year, close to the year-on-year increases of 24% in both 7 and 8.
By region, rates for cargo originating in Africa rose 4% month on month, while those in the Asia-Pacific region and Europe each rose 2%. Rates in the Middle East and South Asia were broadly unchanged, while those in North America fell 3%.
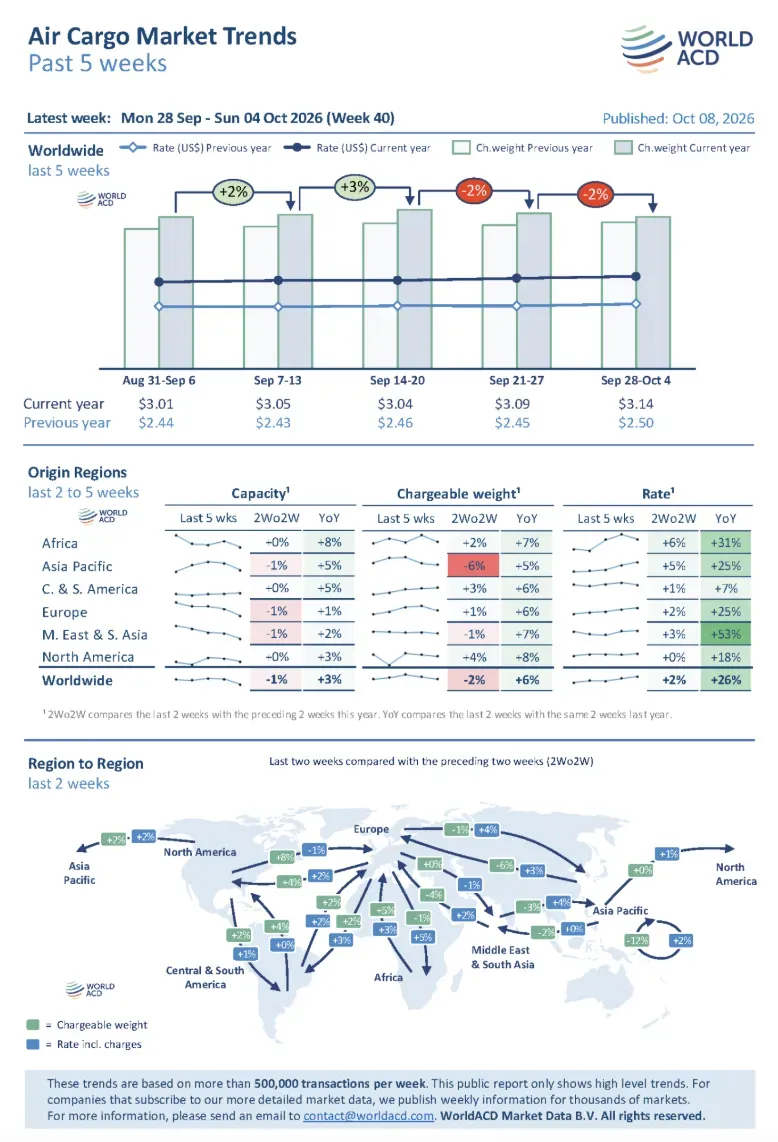
Compared with 2025 9, average rates in the Middle East and South Asia recorded the largest increase, at 52%; rates rose 27% in Africa, 24% in Europe, 23% in the Asia-Pacific region, 18% in North America, and 8% in Central and South America.
Global capacity remained broadly stable in 9, although conditions varied by region. WorldACD data show that in week 40, from 28 2026 9 to 4 10, global air cargo capacity grew by about 4% year on year. Freighter capacity grew 7% year on year, while passenger belly capacity grew 2%. Compared with late 2, before the conflict between the United States and Iran began, global capacity was about 2% higher.
However, routes related to the Middle East remained significantly affected. Compared with late 2, capacity to and from the Middle East and South Asia fell by about 10%, and capacity to and from the Gulf region fell 17%. Capacity in South Asia was broadly stable, declining by just 1%. This means that although overall global capacity increased, transportation options in some regions remained limited, and localized capacity shortages may continue to affect cargo flows and transportation costs.
At the start of 10, global air cargo volume fell for two consecutive weeks. In week 40 of 2026, global cargo volume fell 2% from the previous week, mainly due to a decline in cargo originating in the Asia-Pacific region, where weekly cargo volume fell 2%. WorldACD noted that public holidays began in China and other parts of East Asia in the first week of 10, which was the main reason for this change.
However, the decline in cargo volume did not lead to a corresponding drop in rates. For a second consecutive week, both global air cargo spot rates and average all-in rates rose 1% week on week, with year-on-year increases of 32% and 26%, respectively. This trend is also consistent with the market’s traditional peak season for air cargo gradually approaching from late in the third quarter through early in the fourth quarter.
For the third quarter as a whole, the global air cargo market continued to grow. In the third quarter of 2026, global air cargo volume increased 3% from the second quarter and 6% year on year. All major origin regions recorded year-on-year growth, while the global average rate fell 7% from the second quarter.
In the second quarter, the conflict between the United States and Iran severely disrupted the air cargo market and pushed rates higher. The quarter-on-quarter decline in the third quarter therefore also reflected some easing of the unusually high prices seen earlier. Nevertheless, the global average all-in rate in the third quarter was still up 24% year on year.
In the first nine months of 2026, global air cargo volume grew 5% year on year, and the average all-in rate rose 22% year on year. This shows that although rates on some routes and during some quarters declined, air cargo demand continued to grow, and overall transportation costs remained significantly higher than in the same period last year.
While the global market as a whole recovered, performance on China–Europe routes continued to be affected by changes to Europe’s policies on low-value imports. The EU abolished the tariff exemption for low-value imported goods as of 1 7 2026 and introduced additional charges for low-value parcels.
Following the implementation of the relevant policies, cross-border e-commerce cargo volumes, particularly those originating in Hong Kong, China, and southern China, were affected, and both air cargo volume and rates from China to Europe declined.
WorldACD data show that in 2026 9, total air cargo volume from mainland China and Hong Kong, China, to Europe fell 10% year on year, but the decline was smaller than the 14% in 7 and the 15% in 8. Cargo volume from Hong Kong, China, to Europe fell 24% year on year in 9, while cargo volume from mainland China to Europe fell just 2%.
By comparison, cargo volume from mainland China to Europe fell 5% and 9% year on year in 8 and 7, respectively. WorldACD said that in 9, cargo volume from mainland China to Europe had recovered to nearly the level seen in 6, indicating an improvement in this segment of the market.
Rate movements also reflect the difference between the China–Europe and China–US routes. The average all-in air cargo rate from China to Europe fell from 5.22 dollars per kilogram in 2026 6 to 4.26 dollars per kilogram in 8, then recovered to 4.53 dollars per kilogram in 9. Despite the recovery, rates in 9 were up just 9% year on year, far below the 30% year-on-year increase in 6.
By contrast, the China–US route continued to post strong growth. In 9, air cargo volume from China to the United States grew 17% year on year, and the average spot rate reached 6.05 dollars per kilogram, up 30% year on year. Rates from China to Europe fell from their peak in 6, while cargo volume and spot rates from China to the United States continued to grow, reflecting an increasingly wide gap in market performance as demand shifted in different trade directions.
Overall, global air cargo volume and rates both recovered in 9, but performance varied across regions and routes. Demand for cargo originating in the Asia-Pacific region and North America grew rapidly, while some Middle East routes continued to face capacity declines. The fall in cross-border e-commerce cargo volume from China to Europe narrowed, while cargo volume from China to the United States continued to grow.
Author ✎ Summer/AMZ123
Disclaimer: The copyright of this article belongs to AMZ123. Reproduction without permission is prohibited. For authorization, please contact: amz123happy
Source: Cross-border Logistics Information · Read the original article
Related Learning
AliExpress Local Store Shipping Rules? AliExpress Official Website Entry
With the rapid growth of cross-border e-commerce, more and more merchants are choosing to join the A…
How to Analyze Competitors on AliExpress? How to Grow a New AliExpress Store
In e-commerce, especially on international B2C platforms like AliExpress, understanding and analyzin…

From Losses to Profit: How User Experience Helped a DTC Store Achieve an ROI of Over 4 Within 3 Months | Shenzhen Topu Customer Case
A DTC store is not an advertising machine; it is a business built around user experience. I. Introdu…